Do you have an example block to show how the Firebase dynamic data connects to the chart?
Do you know how to get data from firebase? how it looks like?
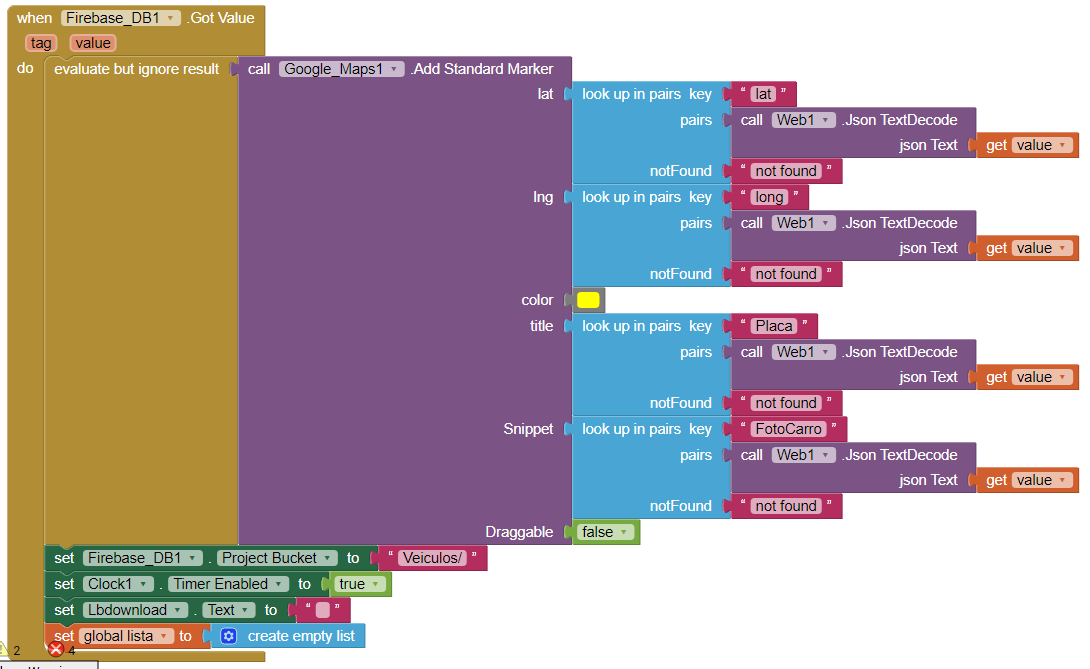

I mean, what the data you want to show in chart looks like?
Data like lat and long, description and some other data from Firebase
I need to change the intervals. It’s 100,200,300 and son on. What should i do to change?
What do you mean by ‘change the interval’?
Hello, I am building a quiz app with a scoring system. At the end of the quiz you receive a percent grade. I wanted to be able to take that percent and then input it into the chart against all of the user’s previous scores to show their progression. Is this possible using these charts?
I have analyzed how these charts work and from what I can tell, if I am able to take the “starting values” (or the score’s the student previously received) and form a text list (for example 25,30,40,55,100) which is attached to the “list from csv row”, then it will chart these numbers. I don’t know if this is possible but I’m new to this and I’d like some guidance. Thank you.
Hi, The_V_Programmer.
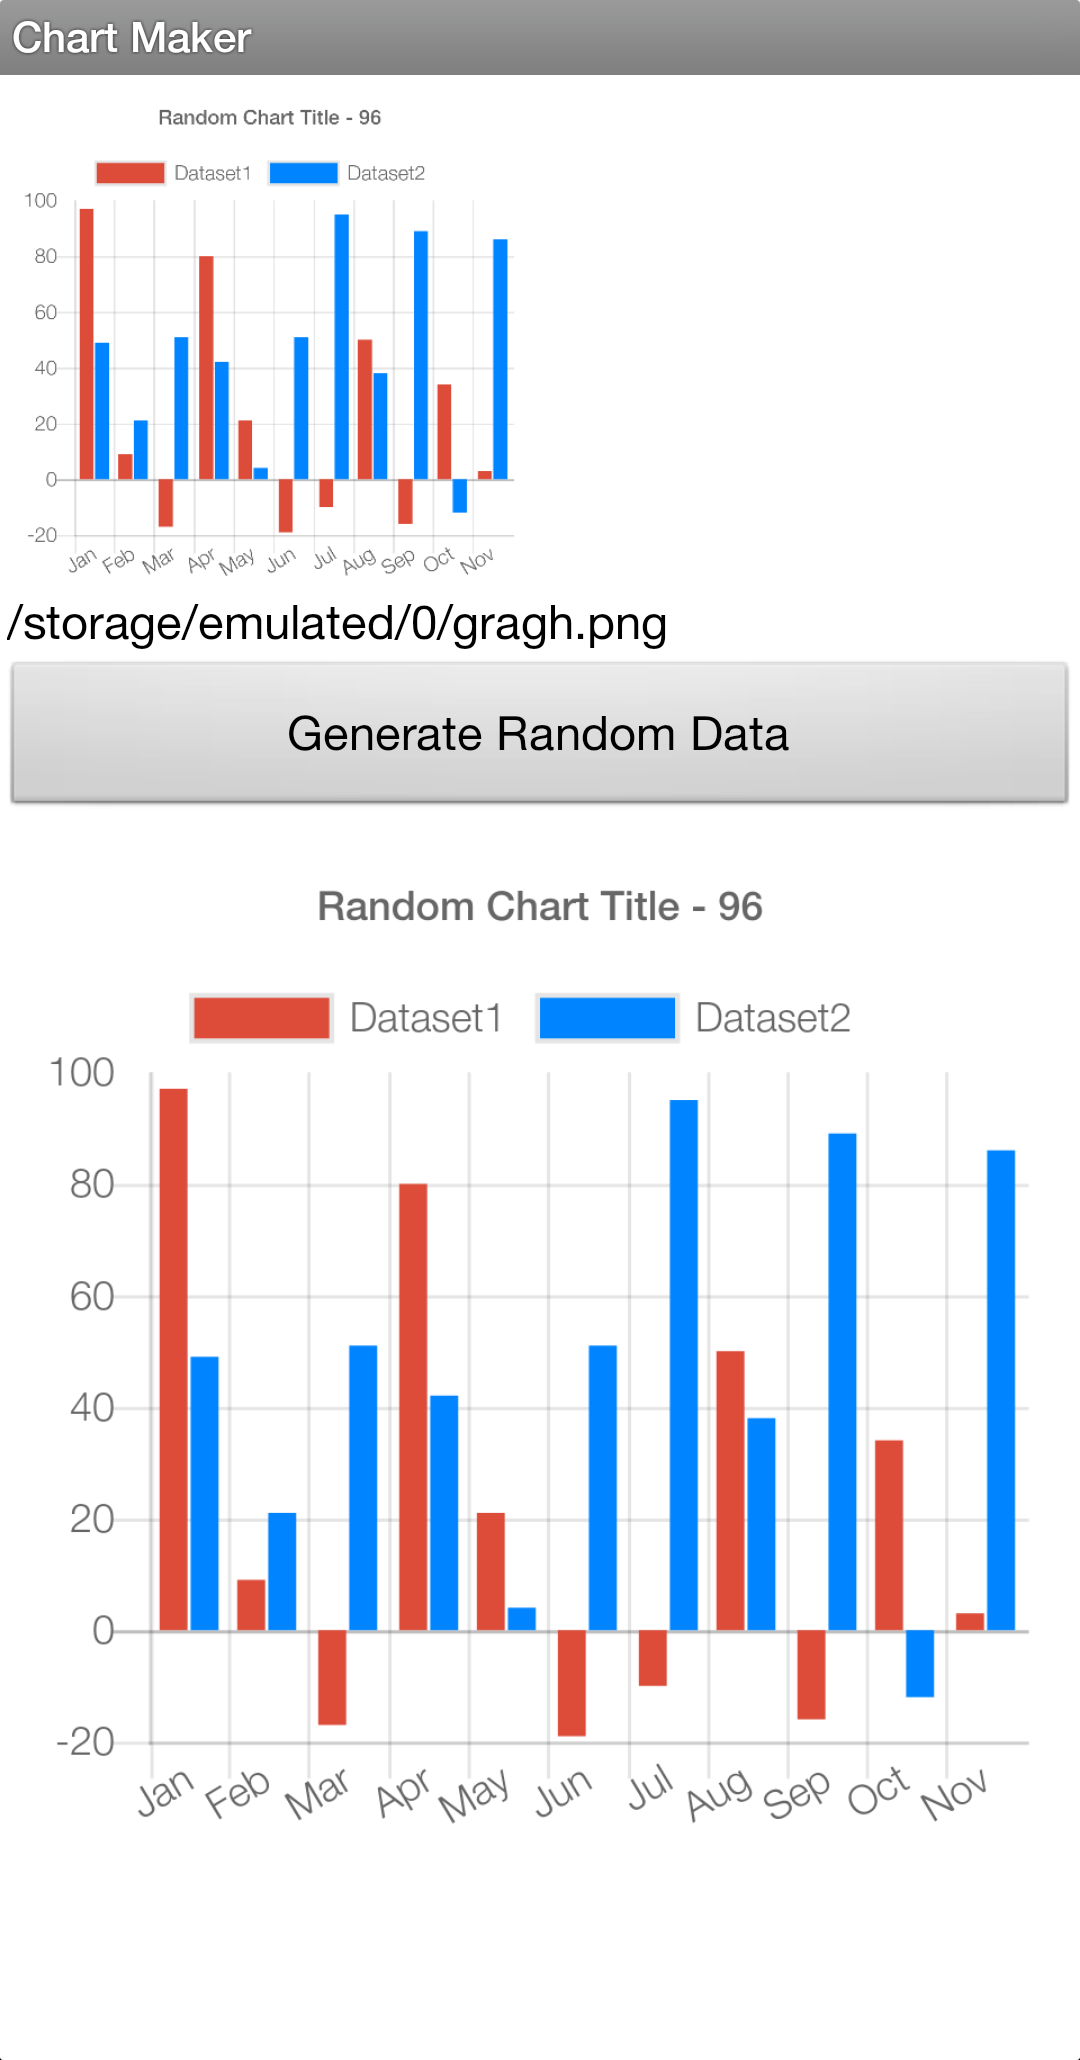
From what I’ve found for the bar chart: In order to change the “y” values change the “list from csv row” numbers- so instead of 123,46,567,357,754 in kevinkun’s example change them to 100,200,300. Note that the number of data sets that appear depend on the number of data in the global_labellist. The number of bars appear depend on the number of csv rows inputted. Not that I have 3 rows of csv numbers and thusly will have 3 bars in each data set.

The intervals are changing based on the data displayed in the chart and also based on the chart type.
Try the same chart type i.e. column with different data or the same data with different charts i.e. column & stacked.
You will notice that numbers displayed in X & Y axis are different…
You can customise various elements of the charts based on your preference but I think you should visit chartjs site and see the documentation there…
Hi!
Is it possible to save the image of the graphic using the app? I have tried with a Tainfun Screenshot extension but it didn´t save the web viewer. Also, I prefer to save only the image of the graphic… some idea?
Maybe this will help:
http://community.thunkable.com/t/free-extension-componenttoimage/39307
Thanks for your help! I tried it and it keeps saving a blank image  , I think it’s because somehow those extensions can only “see” the html link (not the web View String) … which actually appears blank if you see it in the computer’s browser.
I will continue looking 

Even with your aia file it doesn’t works for me. I’m stuck 
Chartjs2 (1).aia (81.5 KB)
Is possible a integration all component and compilate the .aia and upload the final project ?
Sorry I do not understand you
Thanks for it.I already use http://kio4.com/appinventor/169D_javascript_graficos.htm this example but yours is better
Is it possible change background color of the graph from the block side?
How to disable info bar and title for pie chart? I just want show pie chart
“info bar” means legend?
you need modify the pie part of chart.html, as
options: {
title: {
display: false
},
legend: {
display: false
}
}
2 Likes
Thanks,published it to Aİ gallery
ai2.appinventor.mit.edu/?galleryId=4551531237081088 (Without Extension)